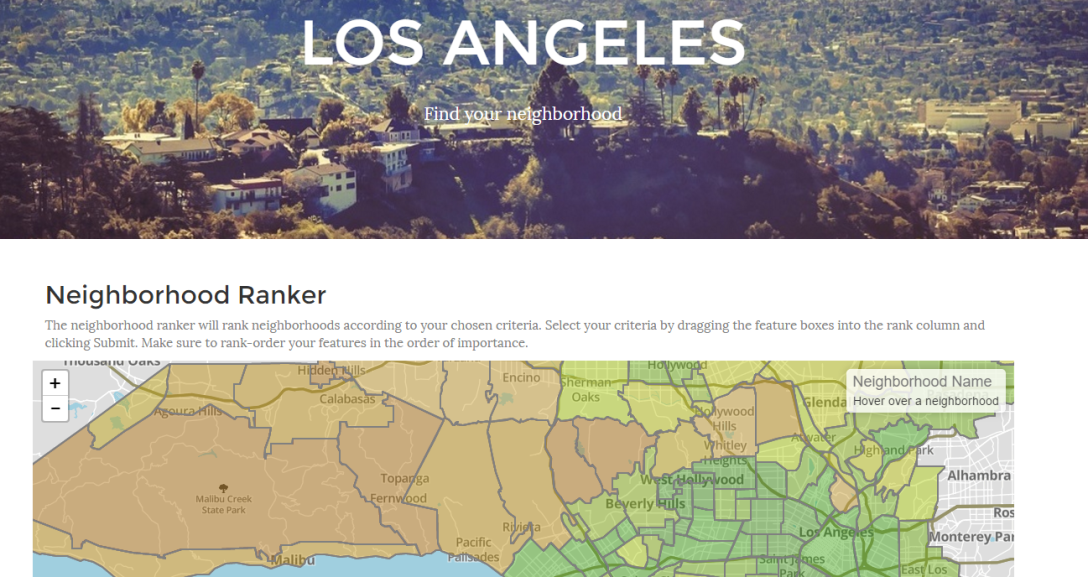
My latest web application is an interactive, personalized map-based ranking of neighborhoods in Los Angeles. I’ve spent the last few weeks gathering data points for each of 155 neighborhoods in the Los Angeles area. That on its own could (and will soon) be the topic of its own post.
For now, I wanted to explain the ranking algorithm I use to come up with the rank score.
First, the features I have gathered on each of the neighborhoods:
- Property Crime
- Violent Crime
- Air Quality
- School Quality
- Population Density
- Restaurant Density
- Price to Buy
- Price to Rent
How to rank neighborhoods based on these characteristics? How to do so in a way that allows users to choose which features they care about and their relative importance?
First, assign each neighborhood a score within each category. For purposes of simplicity, I made each score from 0 to 100. The best neighborhood in each category would rank 100, the worst 0. But how exactly to determine this? Some features are clearly better when low (price, crime) and some are better when higher (walkability, school quality). Furthermore, there is the choice of whether to apply any other transformations to the data such as log-scaling etc.
So I defined functions that transform the data in desired ways.
import math
def standard(n):
	return n
def neglog(n):
	return -math.log(n)
def neg(n):
	return -n
Now I can define a dictionary pairing each dataset with the desired transformation function.
 fundic = {
     'aqf':neg, #air quality
     'hpf':neglog, #house price
     'rpf':neg, #rent pruce
 'pcf':neg, #property crime
 'pdf':standard, #population density
 'rdf':standard, #restaurant density
 'sqf':standard, #school quality
 'vcf':neg, #violent crime
 'wsf':standard, #walkscore
}
Python treats functions as first-class citizens (basically as variables) so this allows us to pass the function from the dictionary basically as any other variable. Within a loop that iterates over each data set, we can select the function corresponding to the dataset stem of choice.
 for stem in list_of_stems:
      fun = fundic[stem]
Now, while loading the data set, we apply the function
 featdic = {}
 for line in datafile:
     feats = line.split(',')
     featdic[ feats[0] ] = fun( float( feats[1] ) )
Here we load the raw value into a dictionary keyed by the neighborhood name. These appear together in the data storage file separated by a comma. Now find the max and min.
 vals = featdic.values()
 minval = min(vals)
 maxval = max(vals)
Now to put the data in order and normalize it.
 orderfile = open('name_order.txt','r')
 for line in orderfile:
     name = line
     rankscore = ( featdic[name] - minval)/( maxval - minval ) * 100.0
So this gives us a rank score now normalized to 0 to 100 and transformed by negative, log or any other transformation we’d like.
Now to address another question: given the user’s rank order of features, how to use that to generate a composite ranking? There is no perfect answer to this question. Of course, you could give the user control over the exact weighting, but this seems like unecssary feature bloat. Instead I decided to weight harmonically. The harmonic series goes like: 1, 1/2, 1/3, 1/4 … This weighting is arbitrary but seems quite natural. First place is twice as important as second, three times as important as 3rd and so on.
On the server side, I have Flask waiting for the names of columns to include in the ranking. First I have a copy of the order of the names in the database. (In this case just a list of lists in a .py file, but could be in a SQL database or other configuration)
names = ["prop-crime",
"viol-crime",
"air-qual",
"school-qual",
"pop-dens-h",
"pop-dens-l",
"rest-dens",
"buy-price",
"rent-price",
"walk-score"]
Now I can define a function to get the composite ranking. First get the number of columns.
def getrank(cols):
    n = len(cols)
Load in the names and the list of scores.
    scoremat = scores()
    nameslist = names()
Now calculate the overall weight from n columns (i.e. the sum from 1 + 1/2 + … 1/n)
norm = sum( [ 1/float(i+1) for i in range(n)] )And now get the rank and index of each feature in the list.
rankinf = [(i+1, nameslist.index(j) ) for i,j in enumerate(cols)]And finally calculate the composite rank for each neighborhood and return it as a list of strings.
    return [ '{0:.1f}'.format( sum( [ 1/float(i)*sl[j] for i,j in rankinf ] )...
        /norm ) for sl in scoremat ]